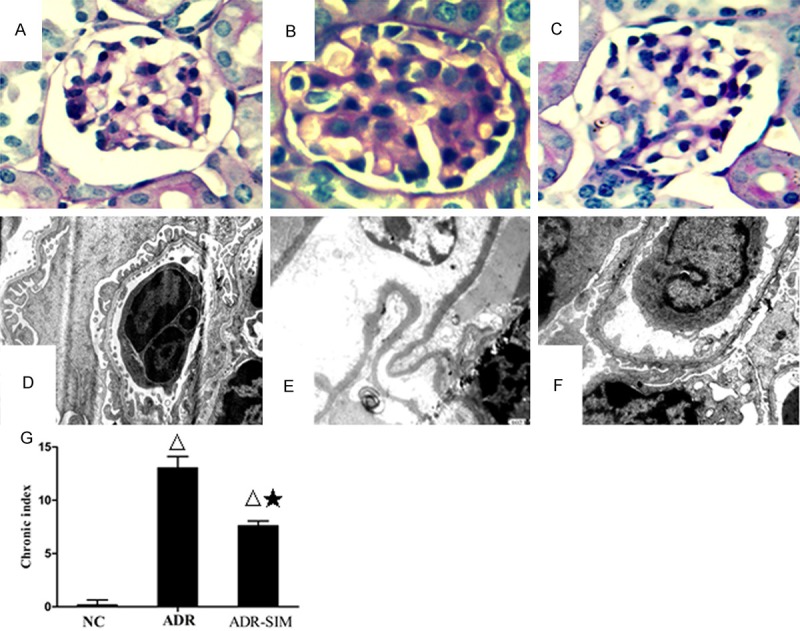
Figure 2.

Renal pathological changes under light microscopy (×400) and electron microscopy (×10000). Renal pathological changes in the NC group (A), ADR group (B) and ADR-SIM group (C) (D) No thickening of GBM or fusion of foot processes in the NC group. (E) Marked thickening of GBM with the proliferation of mesangial matrix and mesangial interposition and extensive fusion of foot processes in the ADR group. (F) Thinning of thickened GBM and partial fusion of foot processes in the ADR-SIM group. (G) CI levels in different groups. Data represent mean ± S. D. P < 0.05 vs. NC group (Δ), P < 0.05 vs. ADR group (★).
