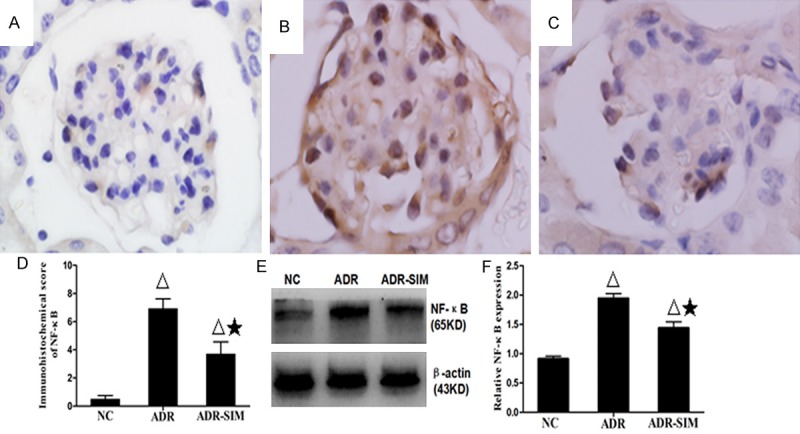
Figure 5.

Expression of renal NF-κB expression in different groups. Immunohistochemical analysis of NF-κB expression in tissue sections of the NC group (A), ADR group (B) and ADR-SIM group (C) (×1000). (D) Immunohistochemical score of NF-κB expression in tissue sections. (E, F) Western blot analysis of renal NF-κB in different groups. Data represent mean ± S.D. P < 0.05 vs. NC group (Δ), P < 0.05 vs. ADR group (★).
