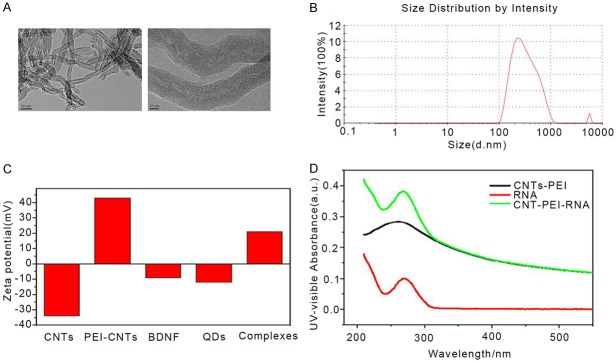
Figure 2.
Characterization of MWCNTs. A. Electron microscope analysis for MWCNT and functionalized MWCNT. B. Representative image of the size distribution of MWCNT. C. Zeta potentials of MWCNT, functionalized-MWCNT, BNDF, and functionalized-MWCNT-BNDF complexes. D. Normalized UV-visible spectra of RNA, CNTs-PEI and CNTs-PEI-RNA complex.

