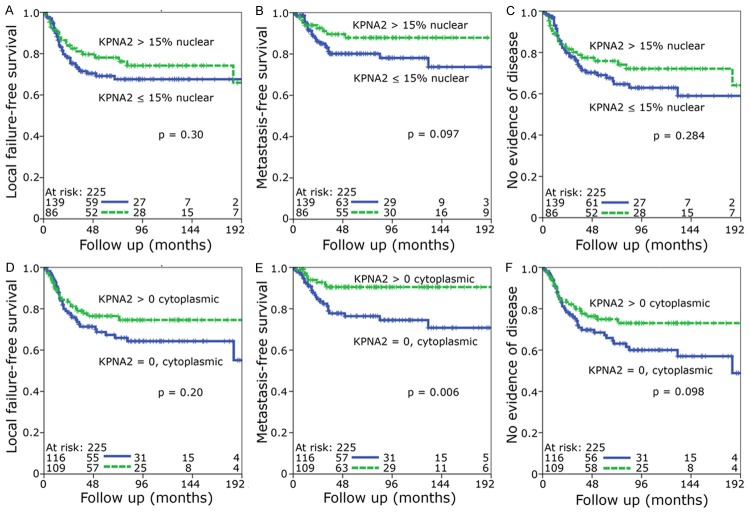
Figure 2.
Kaplan-Meier analysis of low versus high nuclear KPNA2 expression (A-C) and negative versus positive cytoplasmic KPNA2 expression (D-F). The median was used as cut-off value. Statistical significance for the (A, D) local failure-free survival, (B-E) metastasis-free survival and (C-F) no evidence of disease were determined by the log rank test.

