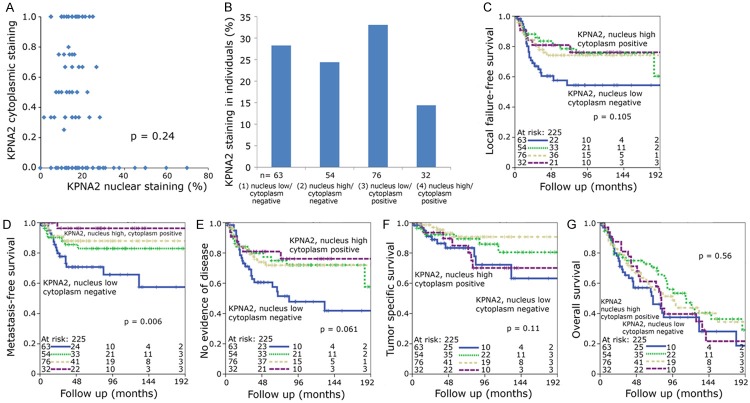
Figure 3.
(A) Scatter diagram comparing individuals’ KPNA2 nuclear and cytoplasmic staining. (B) Percentage of individuals with low or high nuclear KPNA2 combined with negative or positive cytoplasmic KPNA2. Kaplan-Meier graphs of (C) local failure-free survival, (D) metastasis-free survival, (E) no evidence of disease, (F) tumor specific and (G) overall survival analyzed by the log rank test. Individuals were grouped into high nuclear and positive cytoplasmic KPNA2 (long dashed line), low nuclear and positive cytoplasmic KPNA2 (short dashed line), high nuclear and negative cytoplasmic KPNA2 (dotted line) and low nuclear and negative cytoplasmic KPNA2 (solid line).

