
Figure 1.
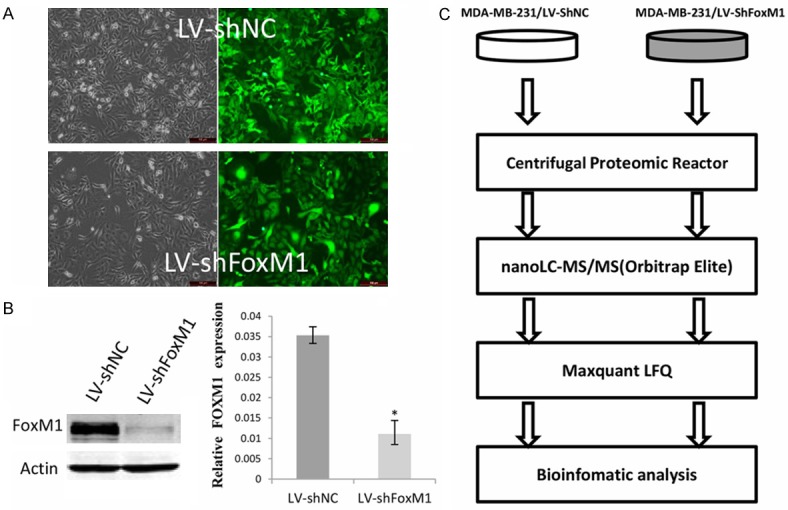
Identification of FOXM1 stable knock down cell line and flow chart of the proteomic study. A. Infection efficiency of MDA-MB-231 cells by LV-shNC and LV-shFoxM1 lentivirus. Left, image under light microscope; right, image under fluorescence microscope showing the expression of green fluorescent protein-positive cells. B. The expression level of FOXM1 in MDA-MB-231/LV-shNC cell and MDA-MB-231/LV-shFoxM1 by Western blot and qRT-PCR analysis. *Statistically different at P<0.05. C. Flow chart of the proteomic study of MDA-MB-231/LV-shFoxM1 and MDA-MB-231/LV-shNC cells. The resulting peptides were analyzed by high resolution nano-LC-MS/MS and quantified with the label-free algorithm in MaxQuant software.