
Figure 3.
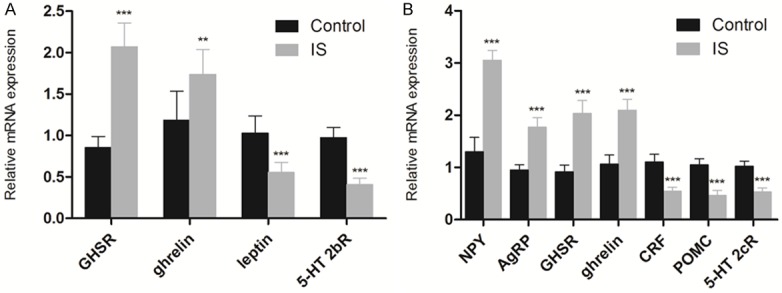
Effects of IS on the expression levels of ghrelin pathway related genes in maternal mice using RT-PCR relative to GAPDH. A. Gene expression profiles of ghrelin, leptin, GHSR and 5-HT 2bR in the stomach. B. Gene expression profiles of ghrelin, 5-HT 2cR, AgRP, NPY, POMC and CRF in the hypothalamus. Gene expression of GHSR, (Control: n = 8; IS: n = 7). **P < 0.01, ***P < 0.001 compared with the control group.