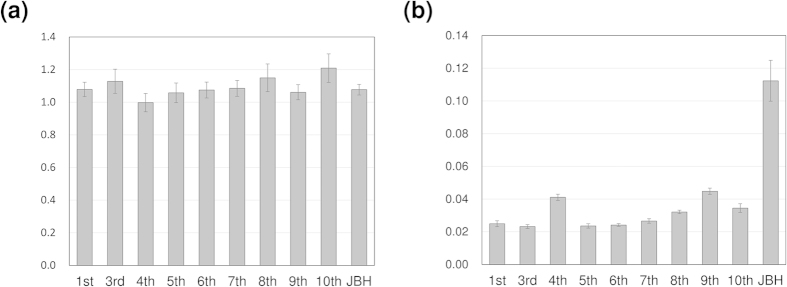
Figure 8. Intensity ratio ±1SE (standard error) versus day after fertilization.
The relative content of lipids and proteins is calculated by the relative intensity of the two characteristic peaks at 4864 cm−1 (proteins) and 4336 cm−1 (lipids) in the second derivative spectra of the (a) yolk and (b) oil droplets.

