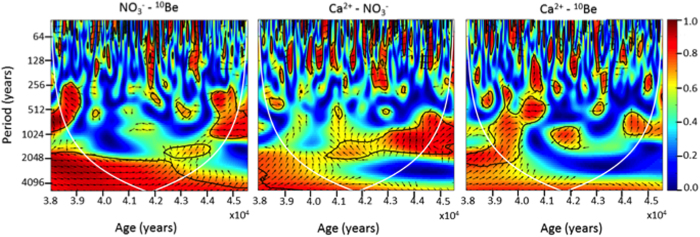
Figure 3.
Wavelet coherence for nitrate and 10Be (a), nitrate and calcium (b) and 10Be and calcium (c) flux measured along the EDC core during the 38–45.5 kyr BP period. The colors indicate the coherence value (see the colorbar), the arrows point to the relative phase between the series (right-pointing arrows correspond to 0 degrees, up-pointing arrows –90 degrees, etc.). The areas of the 5% significance are bounded with black contours. The cone of influence, i.e., the areas of the edge effect, is shown with white lines.

