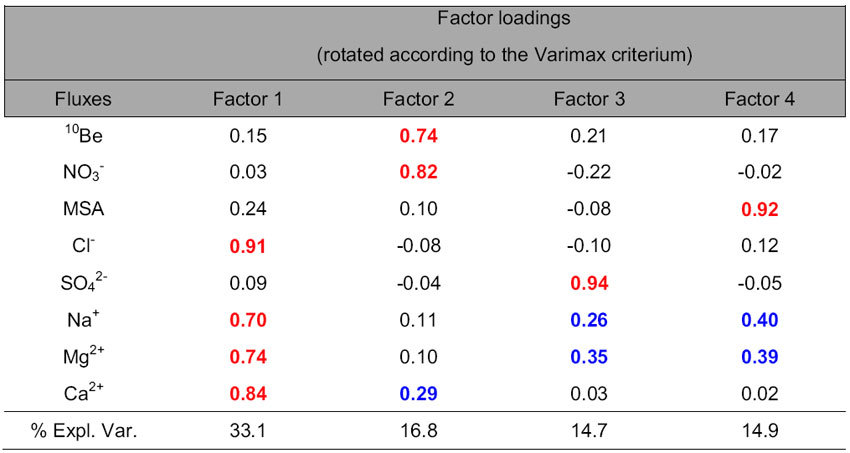
Table 1. Factor loadings and fraction of total variance for PCA applied to 10Be and chemical markers fluxes during the Laschamp event from EDC ice core.

Factor loadings higher than 0.70 are highlighted in bold red and loadings lower than 0.70 but higher than 0.25 are highlighted in bold blue.
