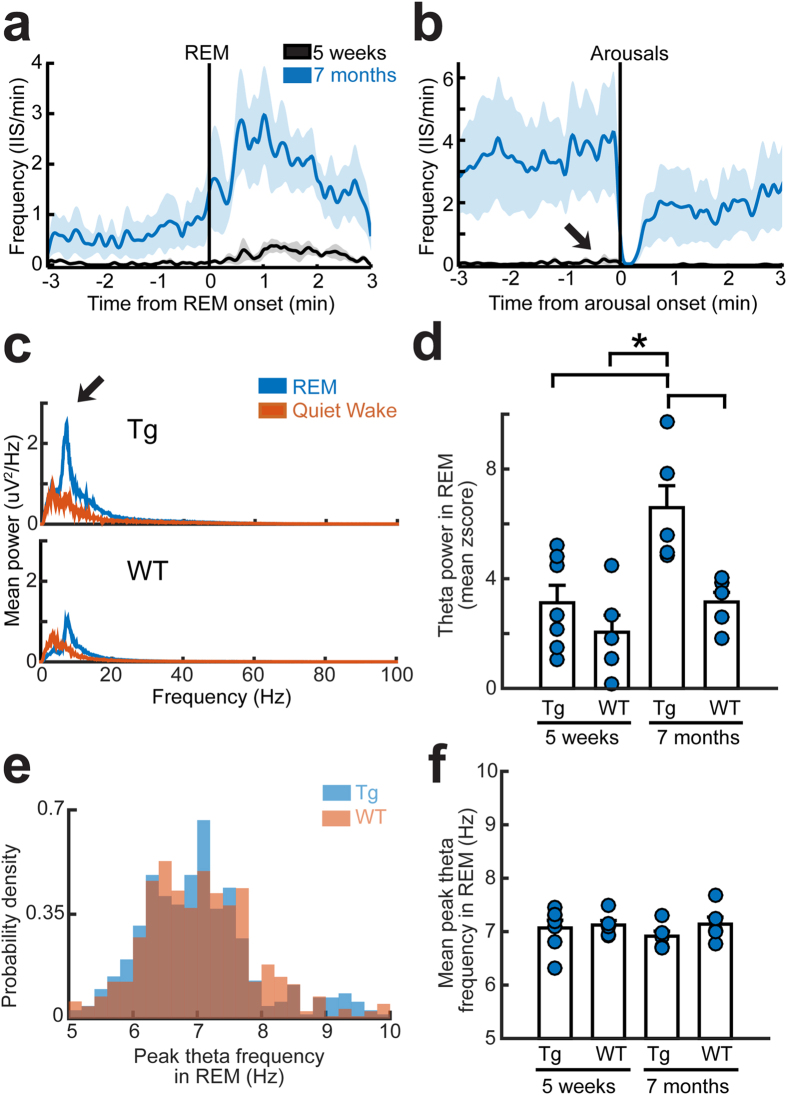
Figure 4. Characteristics of IIS in REM sleep suggest a contribution of the cholinergic system.
(a) IIS frequency is shown as average perievent time histograms (PETHs) in the 3 minutes before and after REM onset. Data from 5 week-old (black; n = 6) and 7 month-old mice (blue; n = 5) are shown, with the means as solid lines and S.E.M. as shaded colors (5 week-old mice, gray; 7 month-old mice, light blue). IIS increased at the start of REM sleep at both ages. (b) The average PETHs for the 3 minutes before and after arousal from sleep in Tg2576 mice at 5 weeks of age and 7 months of age. Same animals and color legend as a. IIS frequency decreased during arousals. (c) Top: Mean power spectra of all REM sleep epochs (blue) or quiet wakefulness epochs (red) in a 24 hour period in a representative 7 month-old Tg2576 (top) and 7 month-old WT mouse (bottom). Note greater power in the frequencies corresponding to theta in the Tg2576 mouse (arrow). (d) Quantification of theta power for all REM sleep epochs in a 24 hour-long recording in 5 week-old WT (n = 5) and Tg2576 mice (n = 7), and 7 month-old Tg2576 (n = 5) and WT mice (n = 5). There was an effect of age (two-way ANOVA, F(1,21)10.253, p = 0.0049) and genotype (F(1,21)9.998, p = 0.0054) with 7 month-old Tg2576 mice having greater theta power compared to all other groups (post-hoc tests, p < 0.05). (e) Histograms show the distribution of peak theta frequencies in all REM sleep epochs during a 24 hour recording session in a representative Tg2576 and WT mouse at 7 months of age. Peak frequencies were similar (quantified in f). (f) There were no significant effects of age or genotype on peak theta frequency during REM sleep (same mice as d; two-way ANOVA, age effect: F(1,21)0.234, p = 0.630; genotype effect: F(1,21)1.044, p = 0.320).

