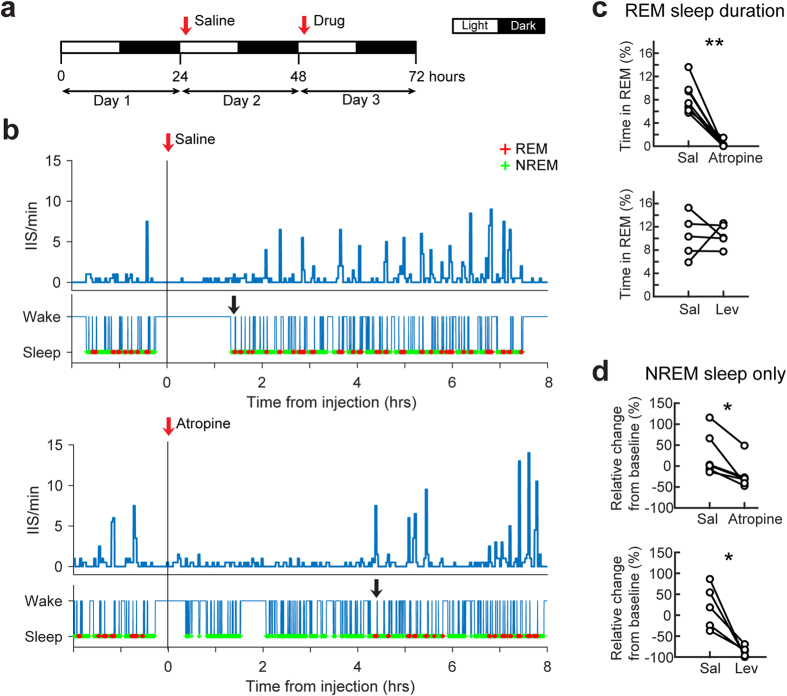
Figure 6. Pharmacology of IIS in Tg2576 mice.
(a) Experimental timeline. Animals were recorded for 3 days. Vehicle (saline) was injected 1 hour after the start of the light period (white bar) on Day 2 (red arrow). On Day 3, drug was injected 1 hour after the start of the light period (red arrow). (b) Top: An example of the responses to saline injection. IIS frequency changes after saline injection (red arrow) are shown as a histogram (2 minutes per bin). Behavioral state (sleep or wake) is shown below the histogram. Red (+) symbols indicate REM sleep and green (+) symbols represent NREM sleep. Bottom: A representative response to injection of the cholinergic muscarinic receptor antagonist atropine (red arrow). Both saline and atropine injection rapidly reduced IIS frequency because of the interruption of sleep induced by the injection. However, IIS resumed when REM sleep returned (black arrows). (c) The effects of injection on the percent of time spent in REM sleep is shown for all animals. Atropine reduced REM sleep more than saline in the 0–4 hours after drug injection (paired t-test, n = 7, p = 0.002) but there was no consistent effect of levetiracetam on REM sleep (paired t-test, n = 5, p = 0.929). Because atropine decreased REM sleep, effects of atropine were analyzed in NREM sleep in part. (d) Atropine significantly reduced IIS frequency in NREM sleep compared to saline (paired t-test, n = 7, p = 0.015). Levetiracetam also suppressed IIS frequency compared to saline (paired t-test, n = 5, p = 0.017). The effects of drugs on IIS frequency were defined as the mean IIS frequency in the 0–4 hours after injection compared to the mean baseline IIS frequency. Mean baseline IIS frequency was calculated from all NREM sleep epochs during the 24 hour period defined as Day 1 (see a).

