
Figure 7. A model of the progressive changes in the Tg2576 mouse with age.
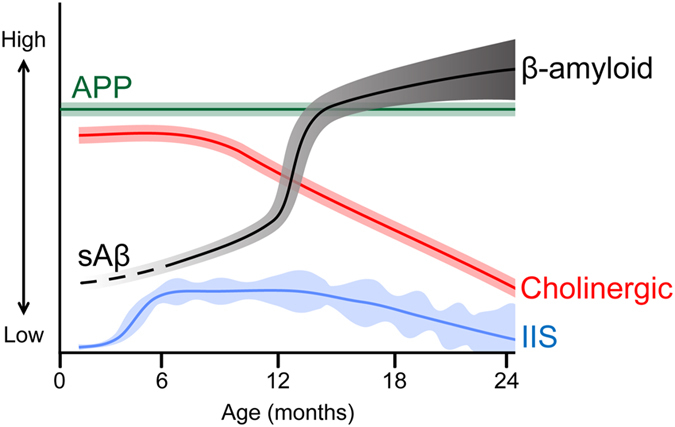
(a) A schematic summarizes the hypothesis that Tg2576 mice have increased cholinergic tone very early in life with concurrent neuronal hyperexcitability, resulting in IIS during sleep. Blue: Mean IIS frequency (line) and variance (shading) increases with age and becomes variable. Red: Cholinergic markers (e.g. ChAT-ir) are elevated early in life and then decline18,30. Gray: Aβ levels are indicated by the line, which increase throughout life. Initially the line is dotted and light gray, reflecting the dominance of soluble Aβ (sAβ). The line becomes solid and dark gray as β-amyloid deposition increases.