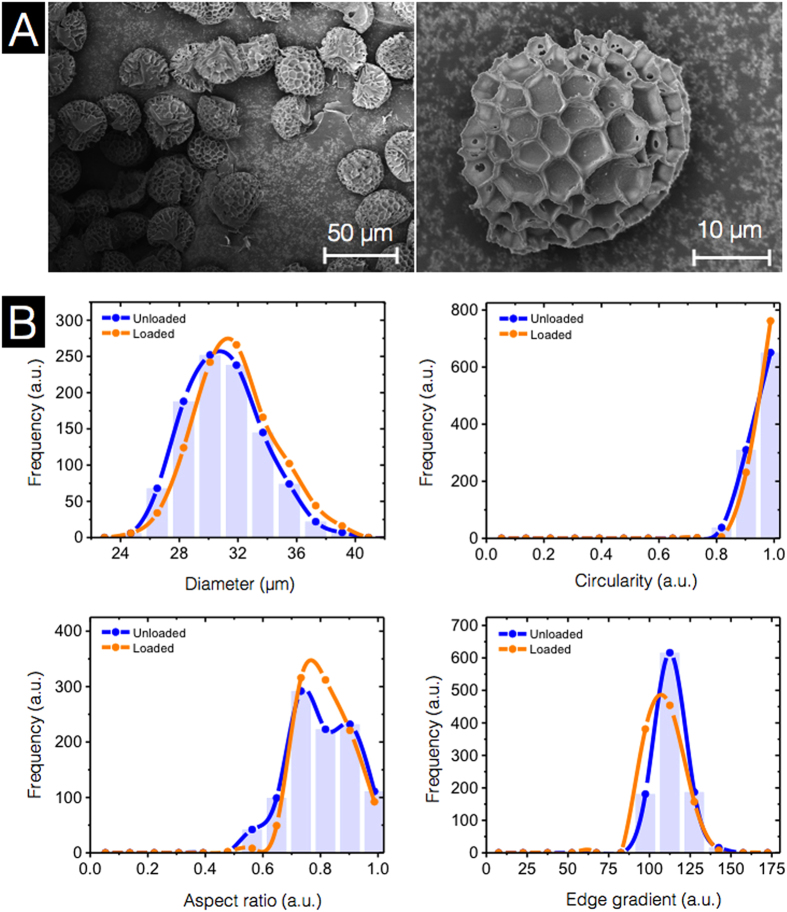
Figure 11. Characterization of BSA-loaded sporopollenin exine capsules (SECs) using scanning electron microscopy (SEM) and dynamic imaging particle analysis (DIPA).
(A) SEM images of BSA-loaded 30 h acidolysis-only SECs. (B) Micromeritic properties of BSA-loaded 30 h acidolysis-only SECs. Plots are representative graphs of diameter, circularity, aspect ratio, and edge gradient, obtained by the spline curve fitting of histogram data from 1000 well-focused particle images from triplicate independent batches (n = 3).

