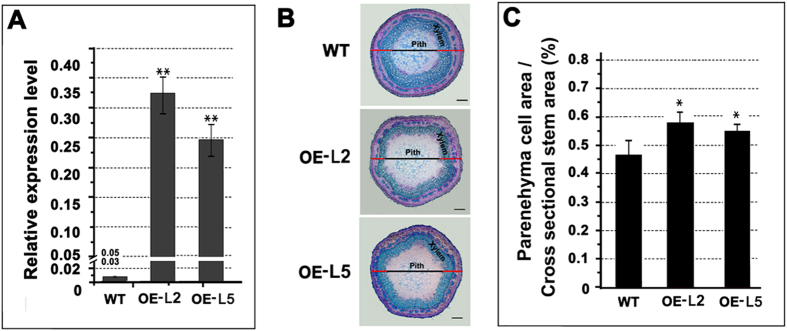
Figure 6. Effect of PtrWRKY19 overexpression in transgenic poplars.
(A) Quantitative RT-PCR analysis of PtrWRKY19 in the wild type and two independent 35S-PtrWRKY19 lines. Poplar 18S was used as an internal control. (B) Transverse sections of the stems from the wild type and transgenic plants. (C) Parenehyma cell area measurements of the stems. Values are means ±SD for n = 4. Asterisks above the bars indicate values determined by Student’s t test to be significantly different from control (**P < 0.01).

