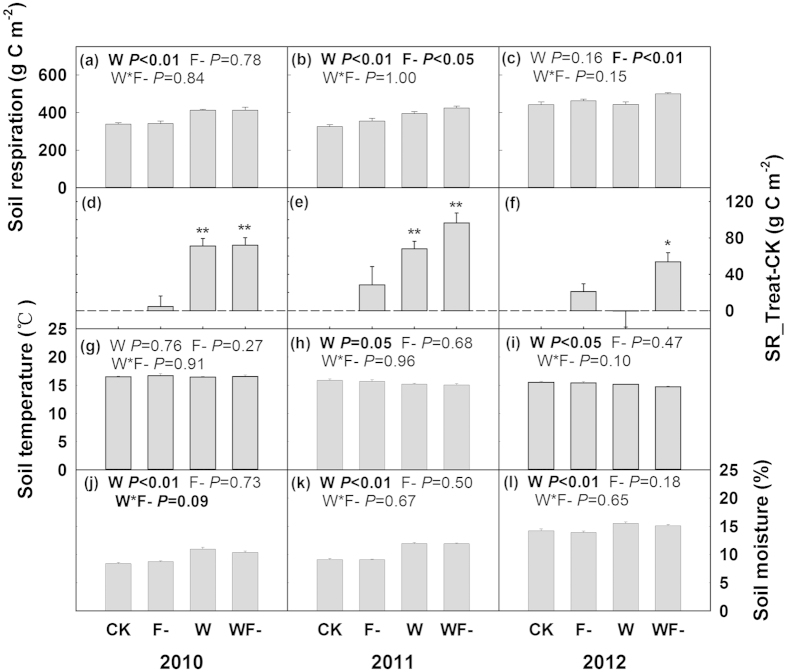
Figure 3. Seasonal accumulated soil respiration.
(a–c), the difference in seasonal soil respiration between the treatments and the control (d–f), seasonal mean soil temperature (g–i) and volumetric soil moisture (j–l) during the growing seasons from 2010 to 2012. Results (P-values) of two-way ANOVA were presented in each subplot (except d–f). * and ** on the bar (d–f) indicate significances from 0 at P < 0.05 and P < 0.01, respectively.

