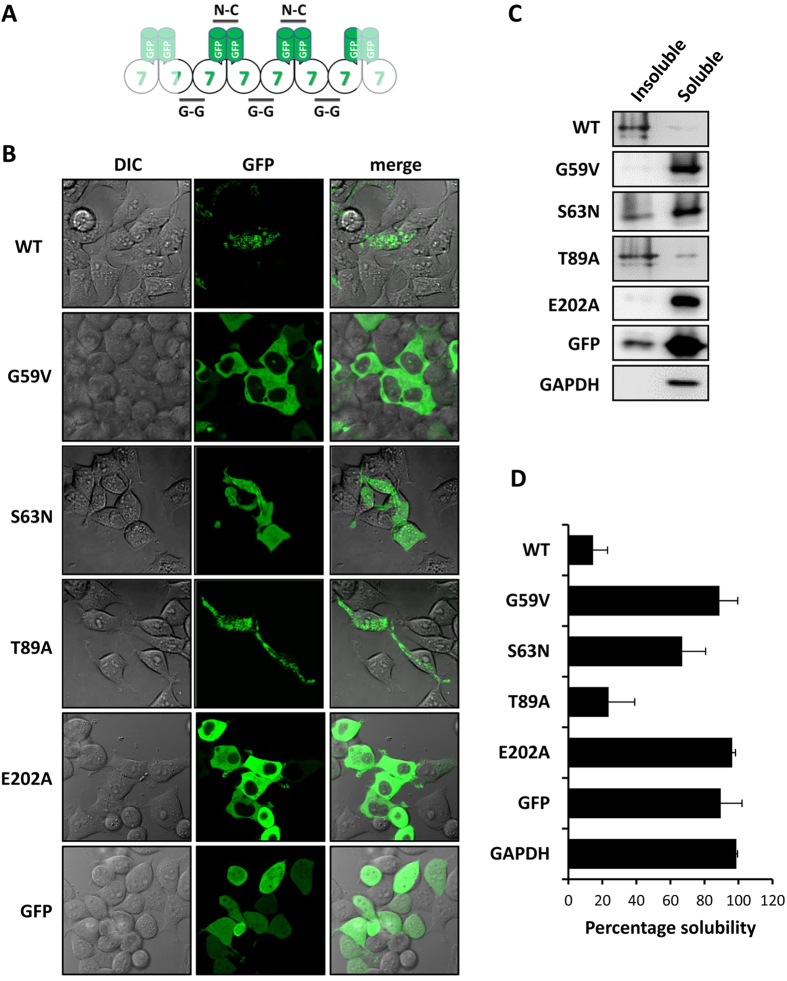
Figure 3. The subcellular distribution and solubility of GFP-tagged SEPT7 mutants in transfected cells.
(A) Schematic representation of homopolymerization by GFP-SEPT7. (B) Live cell imaging showing the structural organization of GFP-tagged wild-type (WT) and mutants SEPT7 in transfected 293T cells. Fluorescent images (GFP) as well as differential interference contrast (DIC) images are shown. (C) Triton soluble and insoluble fractions of lysates were probed with anti GFP antibodies to detect GFP-tagged SEPT7 wild-type (WT) and mutants. GFP alone and GAPDH are shown as control. (D) Quantified band intensities from (C) represented as percentage solubility (average from three independent experiments plotted with standard deviation).

