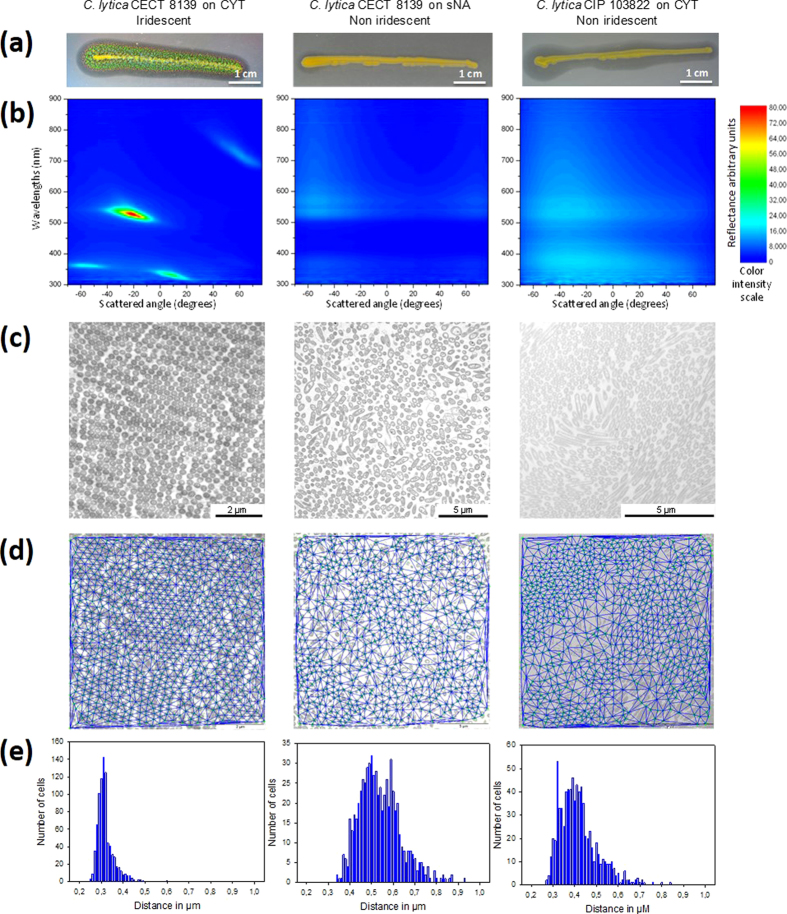
Figure 3. Spectrophotometry of iridescent and non-iridescent C. lytica colonies and TEM and Delaunay triangulations of the internal structures.
(a) Appearances of the colonies (streaking method on agar plate). (b) For spectrophotometry of assays, samples were illuminated at a fixed light angle of −70°. Scattered wavelengths from 300 nm to 850 nm were recorded at different detection angles from −65° to 70° with 2° angle step resolution. Results are shown using a color intensity scale for each scattered wavelength. Wavelength values for each color were as follows: UV, <400 nm; violet, 400 to 435 nm; blue, 435 to 490 nm; cyan, 490 to 520 nm; green, 520 to 560 nm; yellow, 560 to 590 nm; orange, 590 to 620 nm; red, 620 to 700 nm; and infrared, >700 nm. (c) Transmission Electron Microscopy (TEM) images of colony cross-sections obtained by using an adapted protocol (see Methods). (d) Extraction of periodic structures from TEM images with Delaunay triangulations. (e) Each histogram represents the frequency plot of the mean distance from the six nearest neighbours for all the cells in the image. Values are the associated mean distances from the six nearest neighbours and standard deviations.

