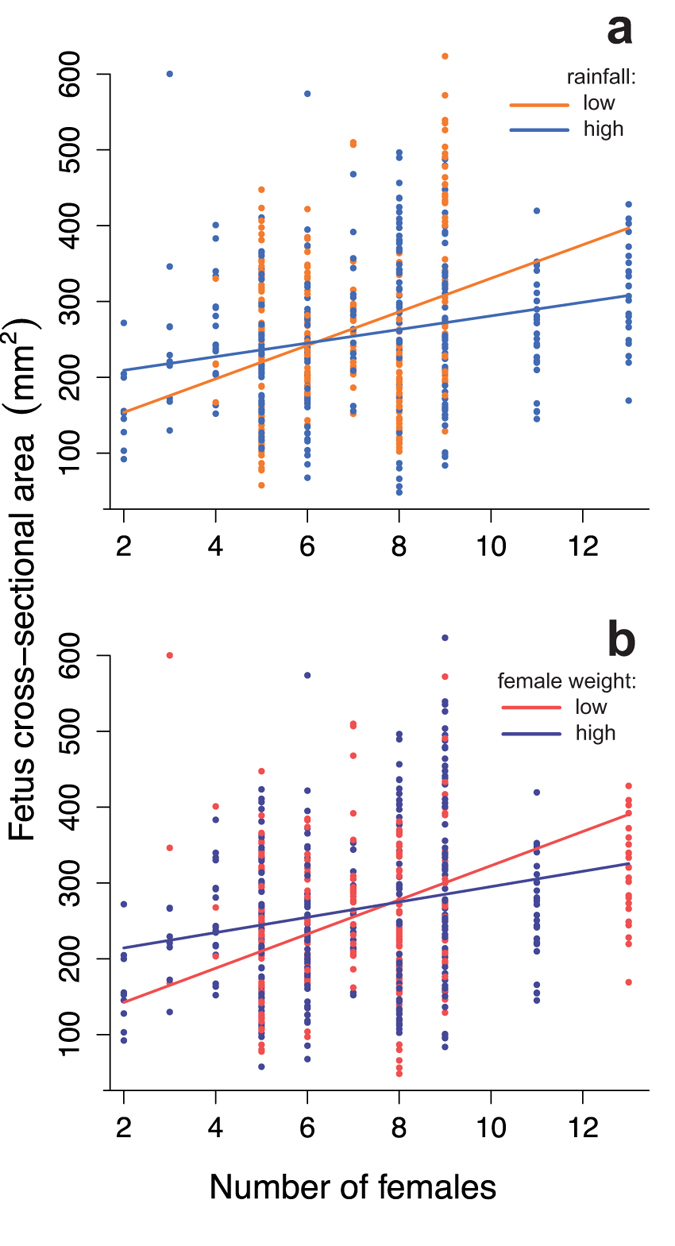
Figure 2. Variation in prenatal investment as a function of the number of adult females in the group at conception.

(a) Fetus cross-sectional area increases more sharply when rainfall is low (orange line) compared to high (light blue line); (b) Lighter females (red line) show the steepest increase in fetus size with female number compared to heavier females (dark blue line). Female weight (mean ± sd = 1447 ± 201 g) and rainfall (mean ± sd = 128.3 ± 40.9 ml) are continuous variables that have been categorized for illustrative purposes using the 25% and 75% quartiles.
