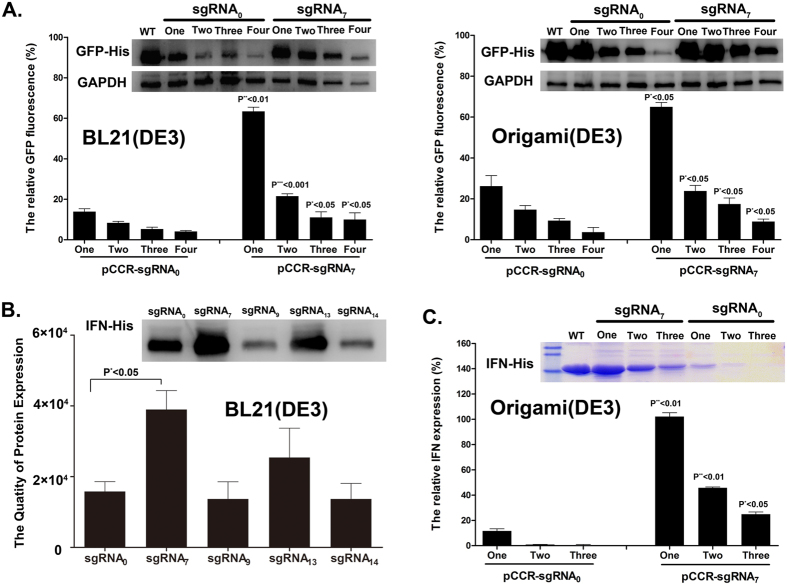
Figure 4. Test of the versatility of CRISPRi-mediated RF1 repression for genetic code expansion.
(A) Comparisons of the effect of CRISPRi-mediated RF1 repression on GFP production in BL21(DE3) vs. OrigamiB(DE3) cells. The expression levels of GFP which contains from one to four UAAs were detected by both Western blotting and fluorescence. The later data were then normalized to that of the wild type GFP. Three independent batches of cells were measured. The Student t-Test was used to determine the statistical difference between means of group and all the P values are less than 0.05; (B) Comparisons of the effect of CRISPRi-mediated RF1 repression on quantitation of M111NAEK-IFN expression via Western blotting analysis. One-way ANOVA with Dunnett’s test was performedo the compare the expression difference all the experimental groups; (C) The sgRNA7-dependent production of IFN-α2 which contains from one to three UAAs analyzed by ComassieBlue staining and quantitated by each band normalized to WT-IFN-α2. IFN-α2 was purified with Ni-NTA chromatography and the loading was normalized to the equal volume of culture medium. The Student t-Test has been used to determine the statistical difference between means of group and all the P values are less than 0.05.

