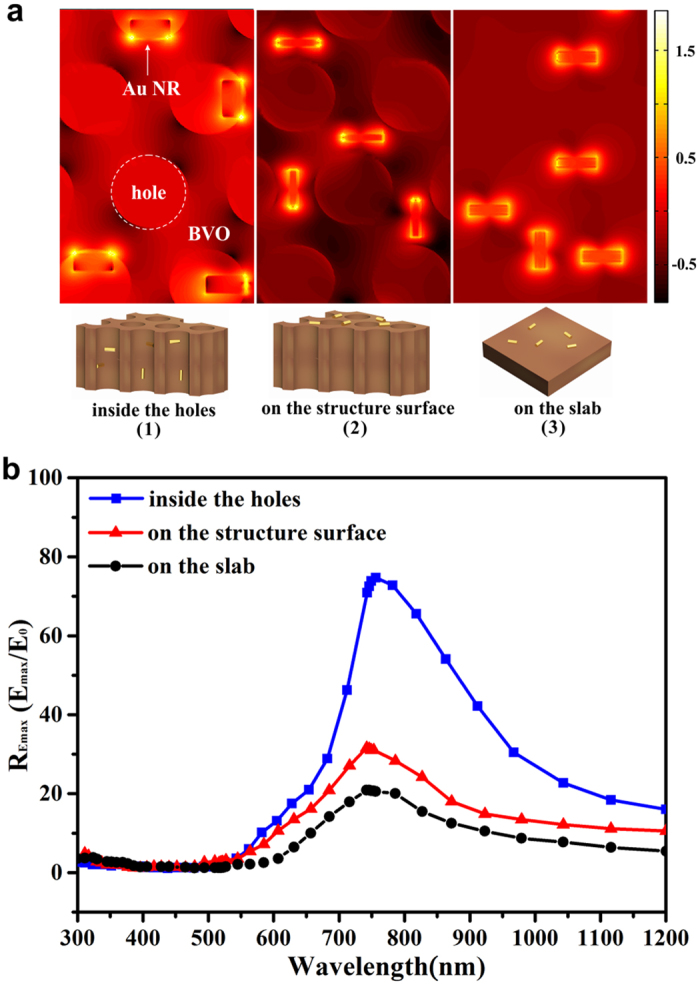
Figure 5. RE in different architectures.

(a) A part of Log (RE) distribution of simulative Au NRs-loaded BVO at 750 nm: (1) inside the holes of BVO wing, (2) at the surface of BVO wing, (3) at the surface of BVO slab. (b) REmax on different monitor planes of simulative Au NRs-loaded BVO models. Insets in (a) represent different Au NRs’ locations corresponding to the Log (RE) distributions above.
