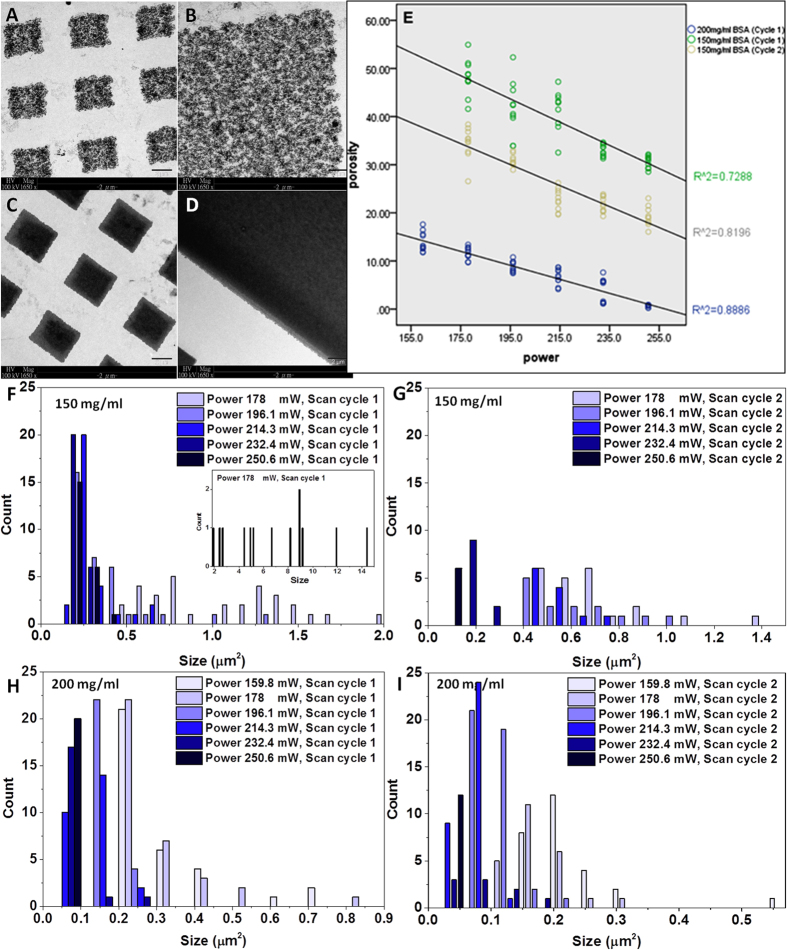
Figure 3. Porosity analysis of the protein micropatterns.
(A–D): Transmission electron microscopy (TEM) images of (A,C) the protein micropillars and (B,D) the micromatrices at a [BSA] of (A,B) 100 mg/ml and (C,D) 300 mg/ml. Scale bars, 2 μm. (E) Scatter plot showing the effect of increasing the laser power (from 150 mW to 250 mW) on the porosity of the micromatrices at [BSA] of 150 mg/ml or 200 mg/ml, and 1 or 2 scanning cycles (n = 10). (F–I) Bar charts showing the size distribution of the top 0.1% largest pores of the protein micromatrices at different laser scanning powers ranging from 178 mW to 250.6 mW at [BSA] of (F,G) 150 mg/ml or (H,I) 200 mg/ml and (F,H) 1 or (G,I) 2 scanning cycles (n = 9–46).

