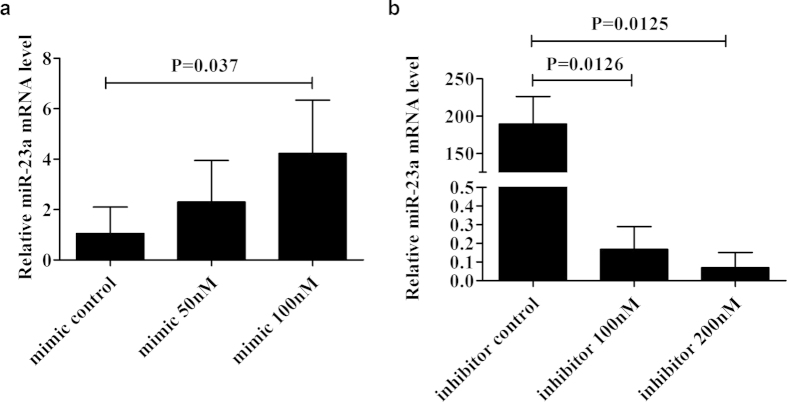
Figure 4. Design condition of miR-23a mimics and inhibitors in human RPE cells.
Measurement of miR-23a mRNA expression was performed after 24-hour transfection. For miR-23a mimics, concentration of 100 nM had a stronger over expression effect than 50 nM. For miR-23a inhibitors, concentration of 200 nM had a stronger inhibitory effect than 100 nM. Data was shown as the mean ± SD of three independent experiments. Paired-sample t test was used for statistical analyses.

