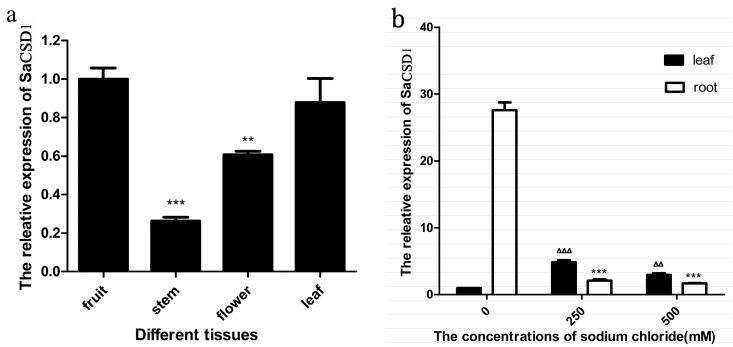
Figure 4.
Real-time PCR analysis of the SaCSD1 transcript. (a) Expression of SaCSD1 in different organs. The highest expression (fruit) was set as 1.0 and ** p < 0.01 *** p < 0.001 means significant differences from it; (b) Expression of SaCSD1 in roots and leaves treated with NaCl solutions. The blank group of leaves was set as 1.0 and, ∆∆ p < 0.01, ∆∆∆ p < 0.001 means significant differences from it, *** p < 0.001 means significant differences from the blank group of roots. CSD1 Data are presented as the mean ± SD of three independent experiments.

