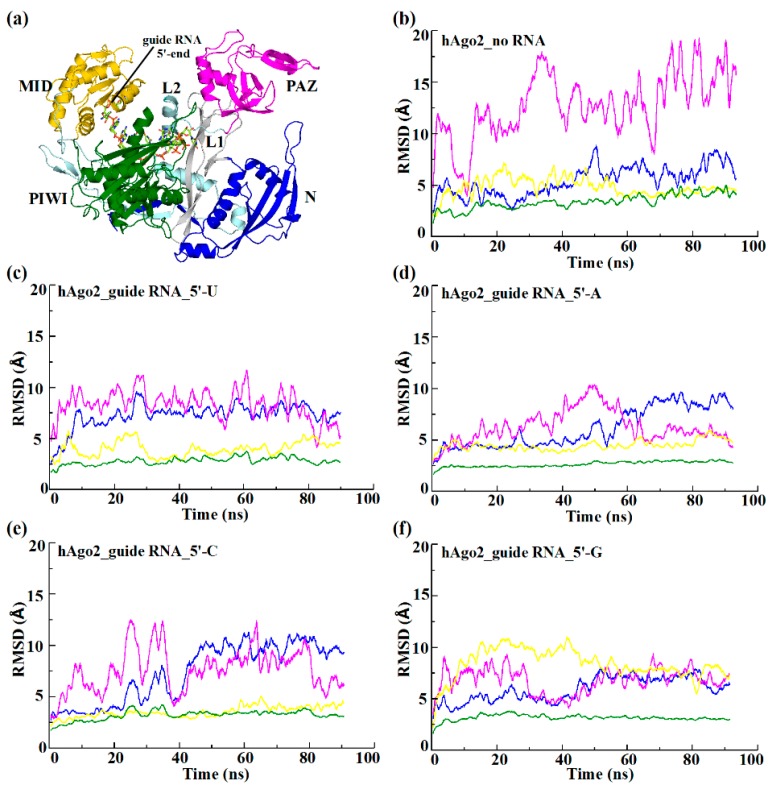
Figure 1.
Analysis of backbone RMSD as a function of the simulation time for various hAgo2/guide RNA complexes. RMSD of the individual domains are calculated after superimposition on backbone atoms of the PIWI domain. (a) X-ray structure of full-length hAgo2 in complex with a truncated 10-mer guide miRNA (PDB 4F3T). The individual domains are labeled and color-coded: N (blue), PAZ (magenta), MID (gold) and PIWI (green) joined by two linker regions, L1 (silver) and L2 (pale cyan). The protein is represented in cartoon and the guide RNA in licorice; (b) Free hAgo2 in the absence of bound guide RNA; and hAgo2–guide RNA complexes with U (c); A (d); C (e); or G (f) at the 5′-end of the RNA.

