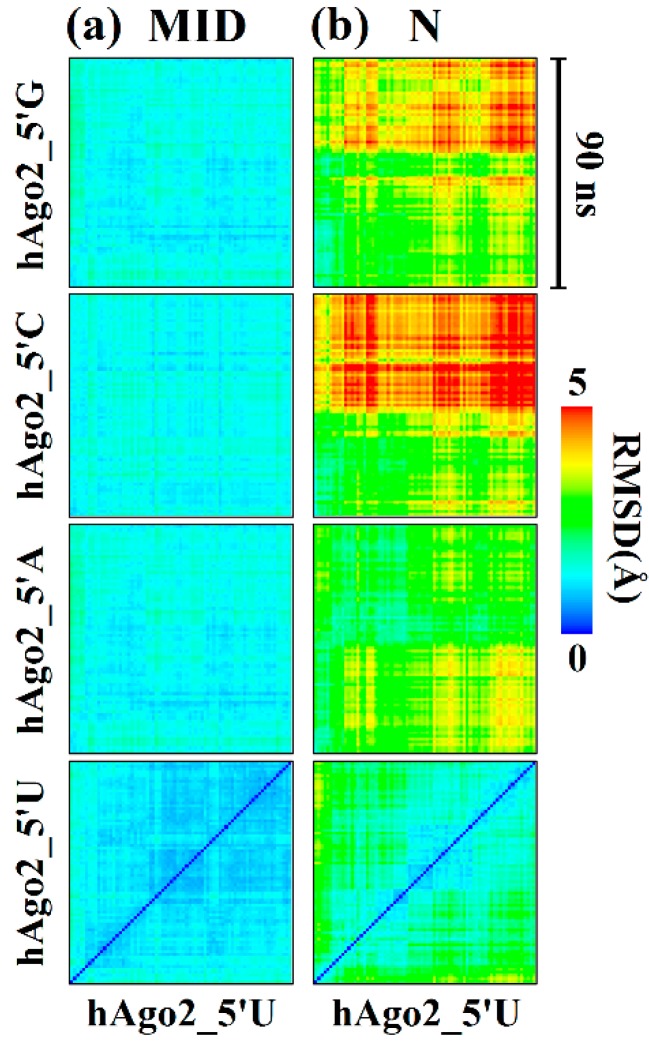
Figure 3.
Cross-RMSD plots of hAgo2 MID (a); and N-terminal (b) domain. Cross-RMSD were calculated after superimposition on backbone atoms of the MID and N domains. The different 5′-bases are indicated on the left. While the RMSDs (color-coded with a gradient from 0 to 5 Å) reveal very little changes in the MID domain between the various 5′-end guides, a clear difference can be observed in the N-terminal domain with gradually increasing RMSDs when switching form 5′-U to 5′-G end guides.

