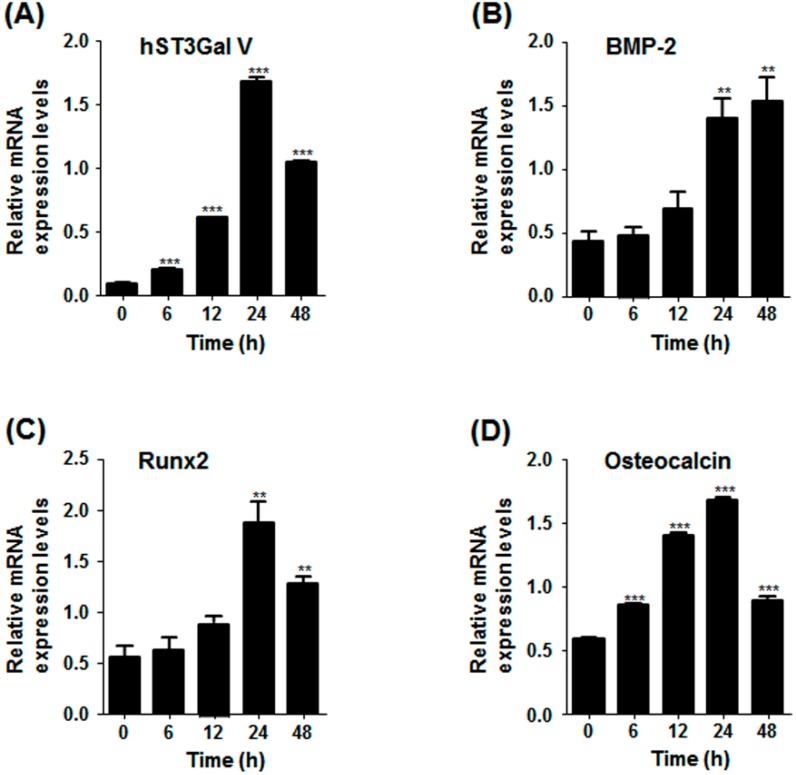
Figure 4.
Quantitative real-time PCR analysis of the expression levels of osteoblastic markers and hST3Gal V in SD-induced MG-63 cells. Total RNA from MG-63 cells was isolated after incubation in serum-free medium for the indicated time periods, and mRNA transcripts of hST3Gal V (A) and osteoblastic markers (B–D) were was analyzed by quantitative real-time PCR. The transcript copy numbers of osteoblastic markers and hST3Gal V were normalized to the β-actin transcript copy number for each sample. Experiments were repeated three times to check the reproducibility of results. ** p < 0.01 (compared to the control); *** p < 0.001.

