Figure 3.
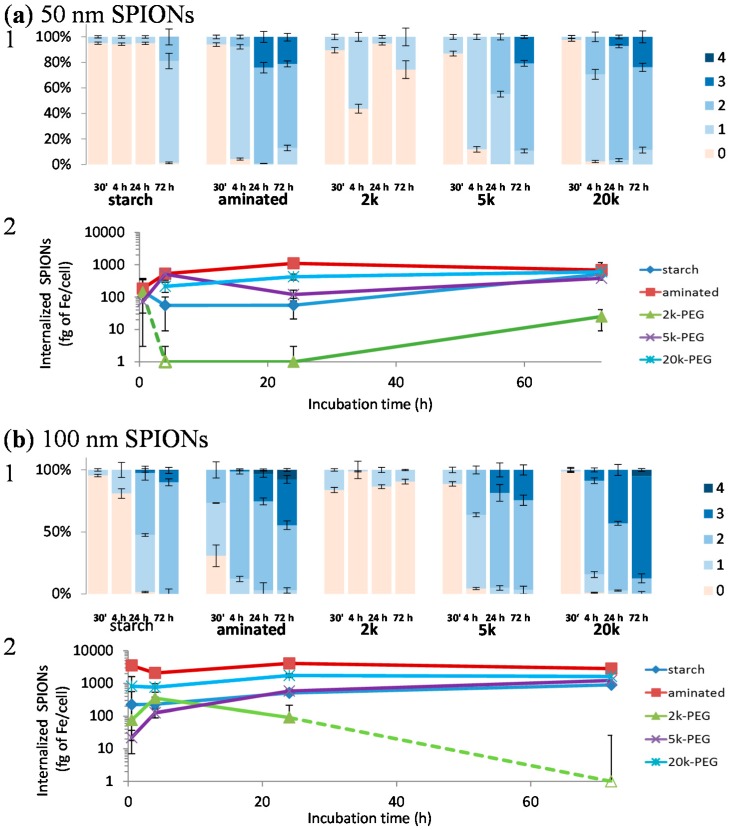
Kinetics of (a) 50 and (b) 100 nm SPION uptake by CHO-K1 cells, represented by (1) Average grading of particles, after 30 min, 4, 24, and 72 h of incubation.  Grade 0 = no blue color,
  grade 1 = faint blue staining in cytoplasm,
  grade 2 = dense blue color in minor portions of cytoplasm (less than 50%),
  grade 3 = deep blue staining in most cytoplasm (>50%) and
  grade 4 = cell filled with intense, dark blue througout; and (2) Quantitfication of internalized iron using a ferrozine assay is reported below the histograms, with evolution of the quantitative uptake over time. Hollow markers indicate concentrations below the detection limit of the assay (i.e., zeros).

