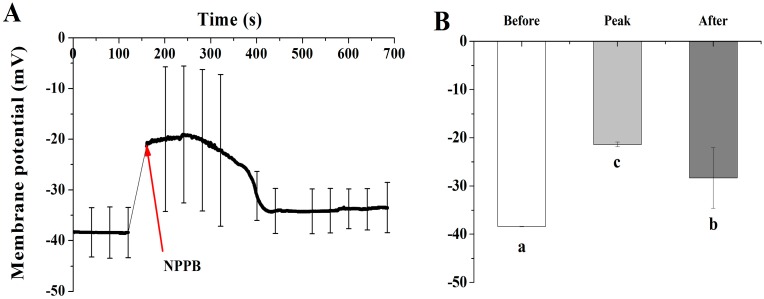
Figure 7.
Effect of NPPB on the membrane potential in tea root mature zone cells. (A) The kinetics of plasma membrane potential in tea root mature zone cells treated with NPPB; (B) Plasma membrane potential at state of before (0 to 120.75 s, without 50 µM NPPB), peak (160 to 300.96 s, with NPPB), and after (120.75 s, with NPPB). Data indicate mean ± SD (n = 8). Error bars indicate the difference among the treatments and different low case numbers near the chart bars indicate the level of significant difference compared with control at p < 0.05.

