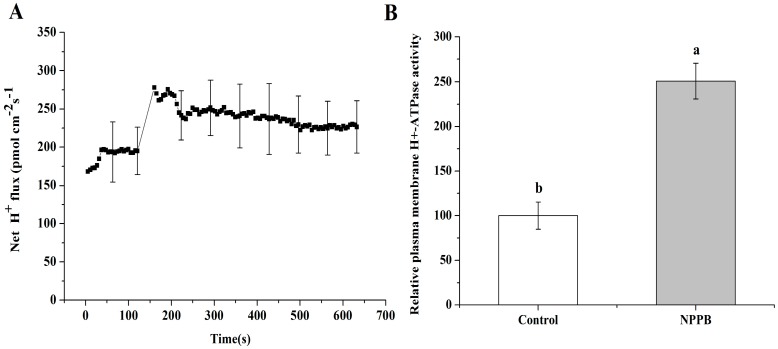
Figure 8.
Influence of NPPB on the H+ flux and plasma membrane H+-ATPase activity in tea roots. (A) The kinetics of net H+ flux in tea root mature zone cells treated with NPPB. Data indicate mean ± SD (n = 6). Error bars indicate differences among the treatments; (B) Control and NPPB indicate that tea roots were treated with distilled water and 50 µM NPPB for 12 h, respectively; Data indicate mean ± SD (n = 4). Error bars indicate differences among the treatments and the letters a, b near the chart bars indicate the level of significance as compared with control at p < 0.05.

