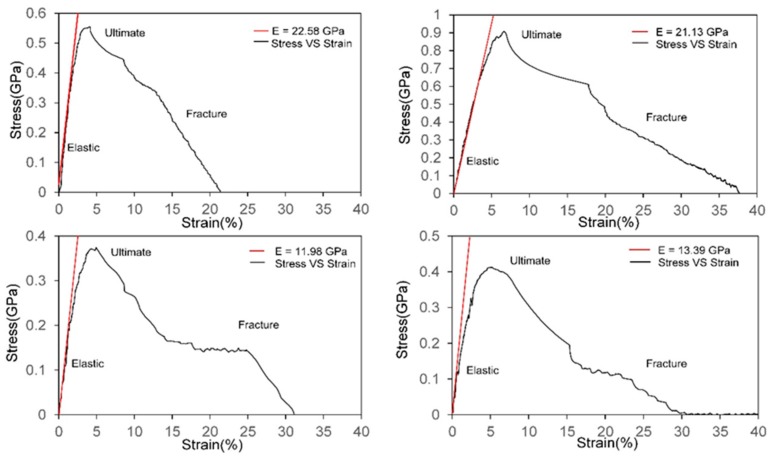
Figure 4.
Stress-strain curves. The curves are initial stress-strain curves generated by the Savitzky–Golay filter method on the basis of the huge amount of raw data points. To generate a smooth curve correctly representing the relationship between stress and strain, we use a cubic function to fit for every 50 data points. The red lines are linear fit for the elastic region, and its slope represents the stiffness. The value of stiffness is shown in the legend. (a,b) are stress-strain curves for chitin model pulling along inter-chain and inter-sheet directions, respectively; (c,d) are stress-curves for 85% chitosan model pulling along inter-chain and inter-sheet directions respectively.

