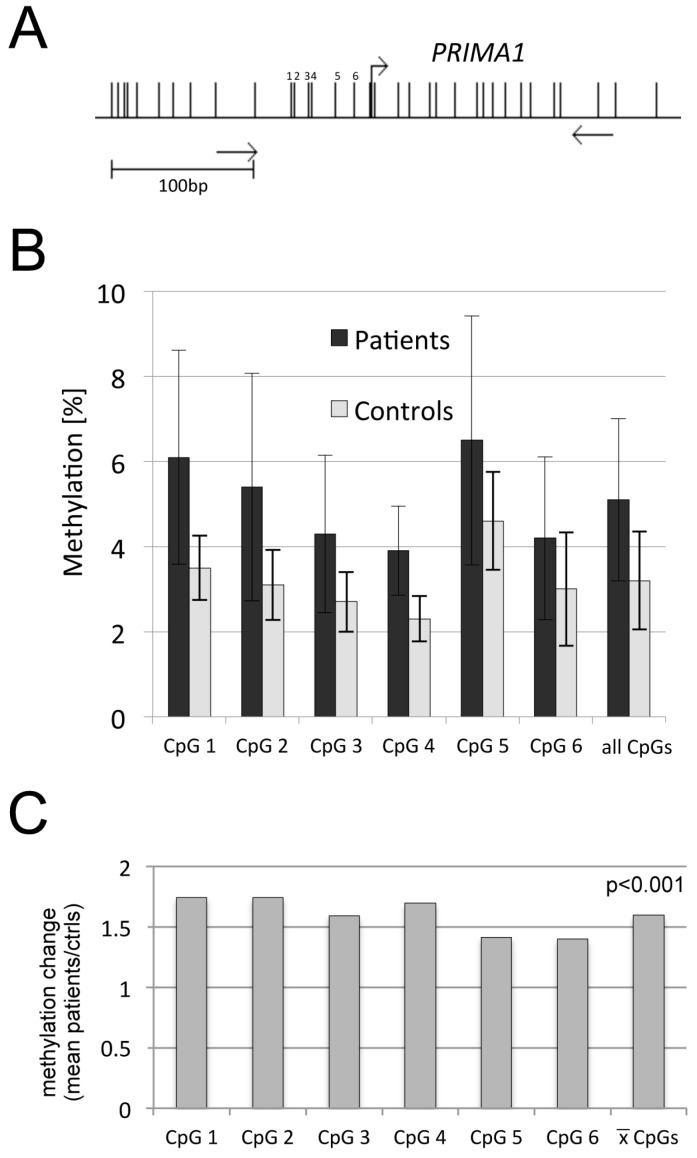
Figure 3.
Methylation analysis of PRIMA1 in blood samples of borderline personality disorder patients and control persons (A) Map of the PRIMA1 gene. Individual CpGs are indicated by vertical lines and the six analyzed CpGs are numbered. Primers are marked with arrows. For details also see Figure 1; (B) Methylation levels of six CpGs located in the proximal promoter region were obtained by bisulfite pyrosequencing. All CpGs indicate the mean methylation of the analyzed region; (C) The quotients between mean methylation levels at individual CpG sites and the sites combined for PRIMA1 in patients and controls (ctrls) were calculated and plotted. Statistical analysis was performed with the two-tailed, paired t-test comparing the mean methylation of matching CpG sites in a specific region.

