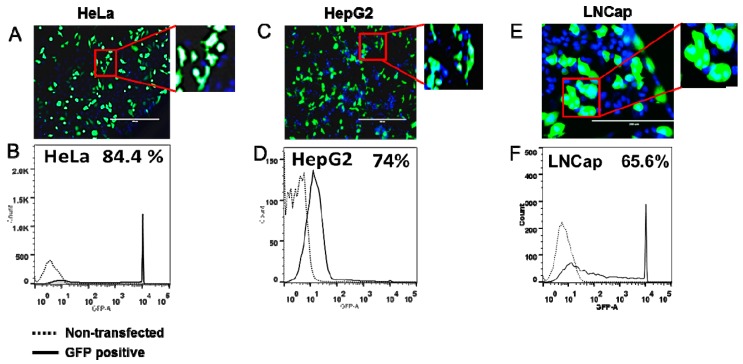
Figure 1.
Transfection standardization in cell lines. Transfection efficiency of cells was assessed by transfection with GFP expressing plasmid. Representative images of GFP expressing (A) HeLa, (C) HepG2 and (E) LNCap cells 24 h post-transfection. Flow cytometer analysis showing GFP positive (B) HeLa, (D) HepG2 and (F) LNCap cells. Scale bar, 200 µm.

