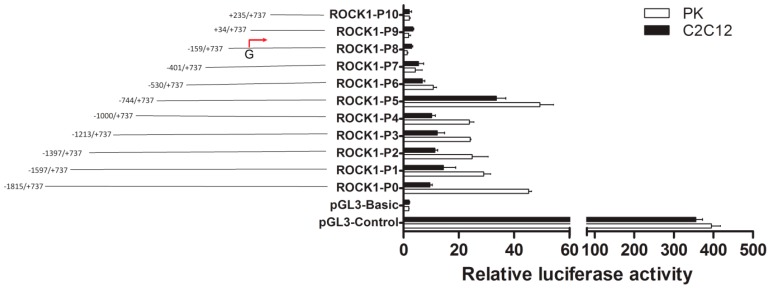
Figure 1.
5’-Deletion analysis of the porcine ROCK1 promoter activity. Schematic representation of the progressive deletions of porcine ROCK1 5’-flanking region in pGL3-Basic vector and the relative activities of ROCK1 promoter corresponding to the progressive deletions. The predicted transcription start site (TSS, the red arrow in the figure) was set +1, differs from the TSS in NCBI database. The pGL3-control/basic vectors were used as positive/negative control, while pRL-TK was used as internal control. Data were expressed as means ± SD of three replicates.

