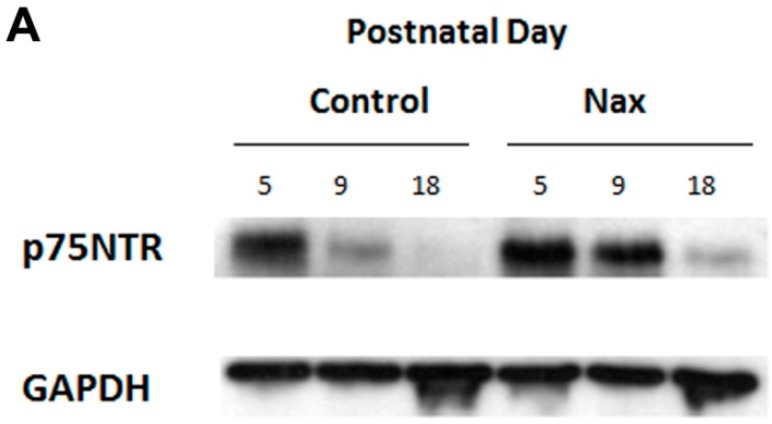
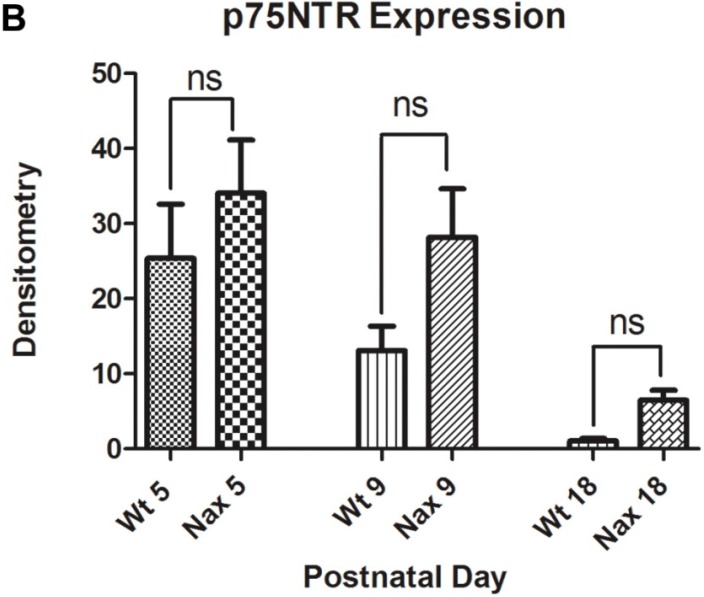
Figure 5.
Western blot analysis of p75NTR expression during cerebellar development at P5, P9 and P18. This experiment was repeated over three different litters for each postnatal days in wt and nax siblings (P5, P9 and P18, wt; n = 9 and nax; n = 9). (A) Immunoblots of total cell lysate from wt sibling and nax mouse cerebellum indicate significant down-regulation in the wt sibling and also in the nax cerebellum from early postnatal development to P18. However, there is no considerable difference in p75NTR expression between the wt and nax cerebellum, despite the higher p75NTR expression in nax compared with wt. (p > 0.05). Protein loading was confirmed using GAPDH (n = 18); (B) The data in the bar graph are presented as the mean ± SEM, and statistical analysis was performed using Kruskal-Wallis test followed by Dunnett’s multiple comparison test using Mann-Whitney test. Abbreviation: ns, not significant.


