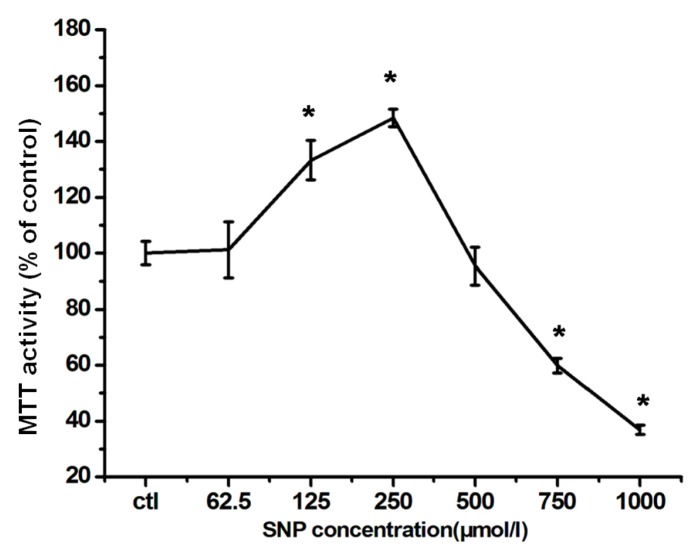
Figure 2.
The neuro-effects of SNP on RGC-5 cells. Cells were exposed to different concentrations of SNP as indicated for 24 h. Cell viability was evaluated by MTT assay. The values were expressed as percentage of control, which is set to 100%. The percentage of MTT activity was presented as mean ± SD for six replicates. * p < 0.05 vs. control group.

