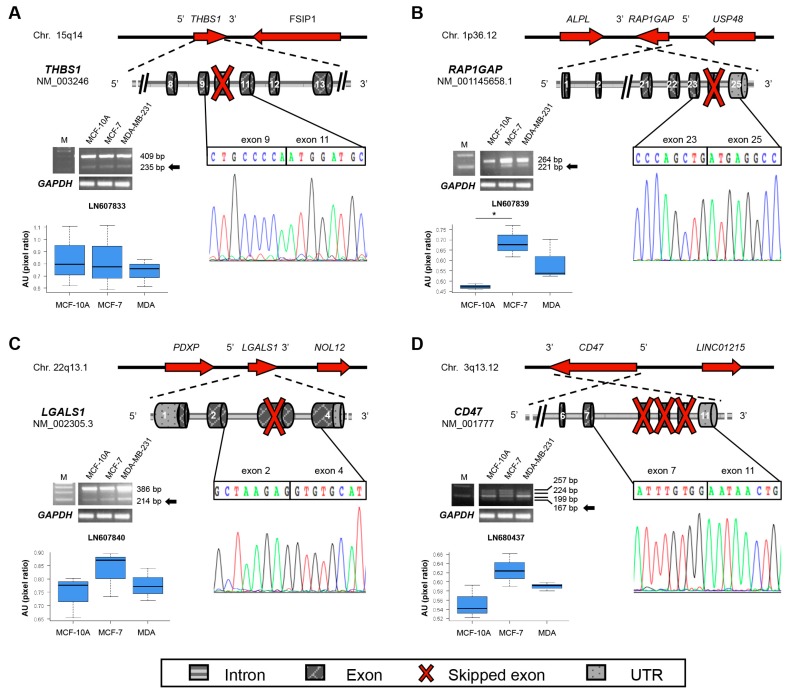
Figure 2.
Schematic representation of de novo identified transcripts for adhesion-related genes and their differential expression by RT-PCR in breast cell lines (a representative image is shown for each gene). (A) THBS1 new transcript; (B) RAP1GAP new transcript; (C) LGALS1 new transcript; (D) CD47 new transcript. For each new transcript, in the upper part is shown the genomic region encompassing the gene; red arrows indicate the direction of transcription. Below, the exon/intron structure of the gene is depicted. Red cross indicates the exons that are spliced out in the new transcript. The electropherogram and the nucleotide sequence above refer to the new splice junction identified. Images of PCR amplicons on agarose gel from three independent replicates experiments were acquired. For all panels, M is 100 bp DNA marker. The black arrows indicate the PCR band corresponding to the newly identified transcripts. Pixel density of each band (only for the newly identified mRNA isoforms) was quantified by ImageJ software and compared to the pixel density of the 100 bp DNA marker (at known concentration) to normalize data across replicates and cell lines. GAPDH gel bands are reported below to show that the starting amount of template was the same for all analyzed samples. Values are reported as AU = Arbitrary Units in the boxplots. Dark horizontal lines represent the mean, the box represents the 25th and 75th percentiles and the whiskers the 5th and 95th percentiles. Asterisks indicate significant p values (* p < 0.05).

