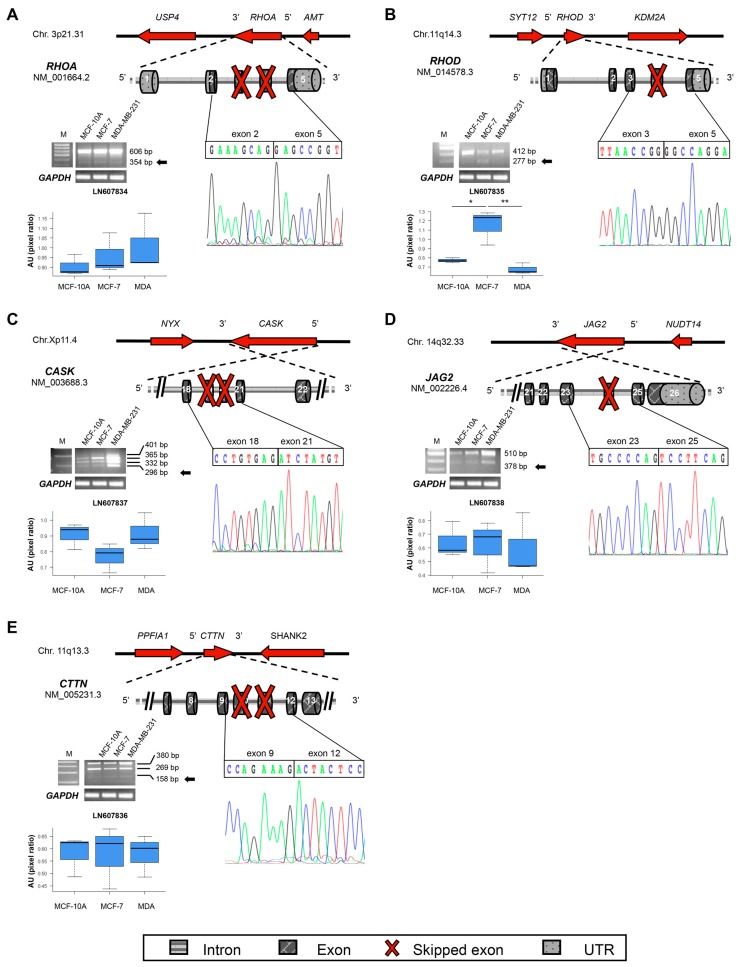
Figure 3.
Schematic representation of de novo identified transcripts of motility-related genes and their expression by RT-PCR in breast cell lines (a representative image is shown for each gene). (A) RHOA; (B) RHOD; (C) CASK; (D) JAG2; (E) CTTN new transcripts. Details about the gel bands and their quantification are provided in Figure 2 legend. Asterisks indicate significant p values (* p < 0.05; ** p < 0.01).

