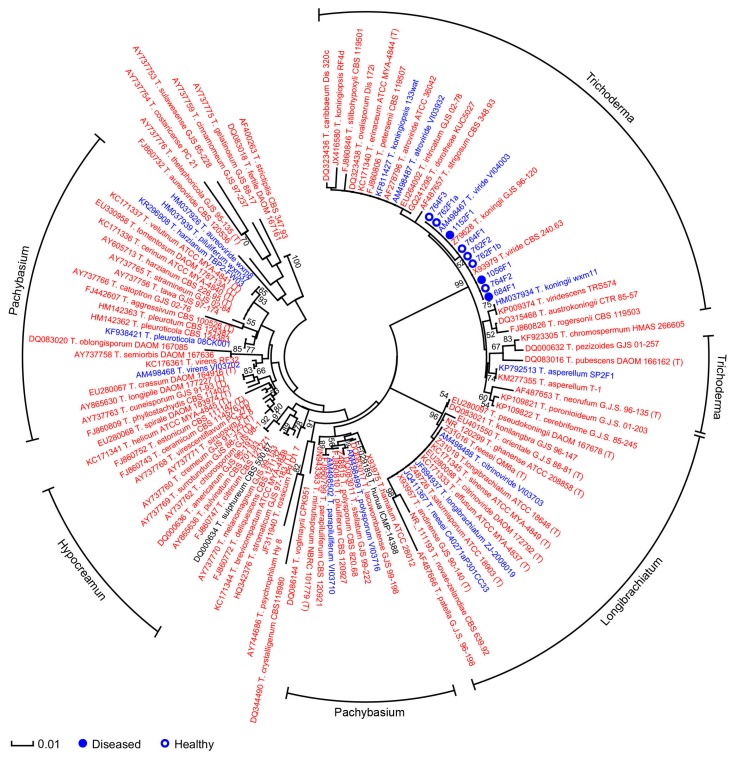
Figure 5.
Phylogenetic tree of ITS rRNA sequences of nine Trichoderma isolates and reference strains. The phylogenetic analyses were conducted in Mega 5 using the Tamura 3-parameter method [70] to compute evolutionary distances. The bootstrap values indicated at the nodes are based on 1000 bootstrap replicates. Branch values lower than 50% are hidden. Closed and open circles indicate isolates from Saprolegnia-infected (diseased) or healthy samples, respectively. Red, blue and black colors indicate strains from terrestrial/plant, aquatic and unknown sources of isolation, respectively. The scale bar indicates an evolutionary distance of 0.01 nucleotide substitution per sequence position. Outer labels describe section names based on the list of species in ISTH website [64] and only sections contained at least five strains are indicated. 104 ITS sequences of good quality and at least 550 bp of reference strains of Trichoderma were downloaded from GenBank; their corresponding strain names are preceded by the accession numbers. Strain names followed by “(T)” indicate type strains.

