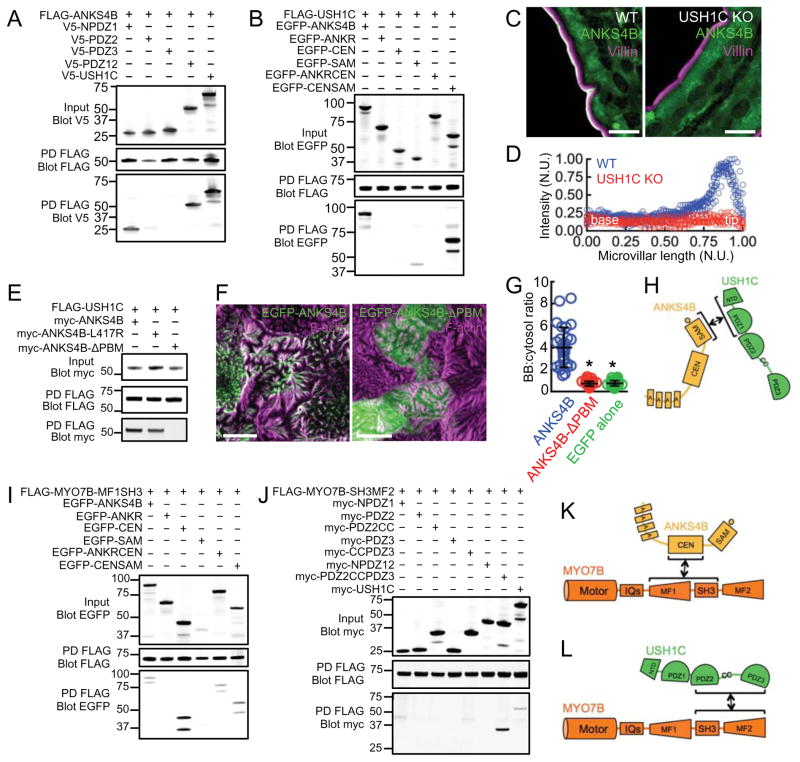
Figure 4. Analysis of binding interactions between ANKS4B, USH1C, and MYO7B.
(A) Mapping binding interactions between full length ANKS4B and sub-domains of USH1C; FLAG-tagged ANKS4B served as bait whereas V5-tagged fragments of USH1C served as prey. PD = pulldown. (B) Mapping binding interactions between full length USH1C and ANKS4B sub-domains; FLAG-tagged USH1C served as bait where as EGFP-tagged fragments of ANKS4B served as prey. (C) Confocal microscopy of ANKS4B (green) and villin (magenta) staining in duodenal tissue from wild type and USH1C KO mice. Scale bars, 10 μm. (D) Line scan analysis of ANKS4B signal intensity parallel to the microvillar axis as visualized in confocal images of wild type and USH1C KO tissue. N.U. = normalized units. (E) Analysis of binding interactions between full length USH1C and mutant forms of ANKS4B lacking a functional PBM; FLAG-tagged USH1C served as bait whereas myc-tagged ANKS4B variants served as prey. (F) Confocal images of 12 DPC CACO-2BBE monolayers stably expressing EGFP-ANKS4B (left) and EGFP-ANKS4B-ΔPBM (right). Scale bars, 10 μm. (G) Quantification of BB:cytosol EGFP signal intensity ratios for EGFP-ANKS4B, EGFP-ANKS4B-ΔPBM, and EGFP-alone. Bars indicate mean ± SD. *p < 0.0001, t test. (H) Cartoon depicting the mechanism of ANKS4B/USH1C interaction. (I) Mapping binding interactions between the MYO7B-MF1SH3 tail fragment and sub-domains of ANKS4B; FLAG-tagged MYO7B-MF1SH3 tail fragment served as bait whereas EGFP-tagged fragments of ANKS4B served as prey. (J) Pull-down analysis of interactions between the MYO7B-SH3MF2 tail fragment and sub-domains of USH1C; FLAG-tagged MYO7B-SH3MF2 tail served as bait whereas myc-tagged fragments of USH1C served as prey. (K and L) Cartoons depicting mechanisms of binding between MYO7B and ANKS4B or USH1C.

