Fig. 2.
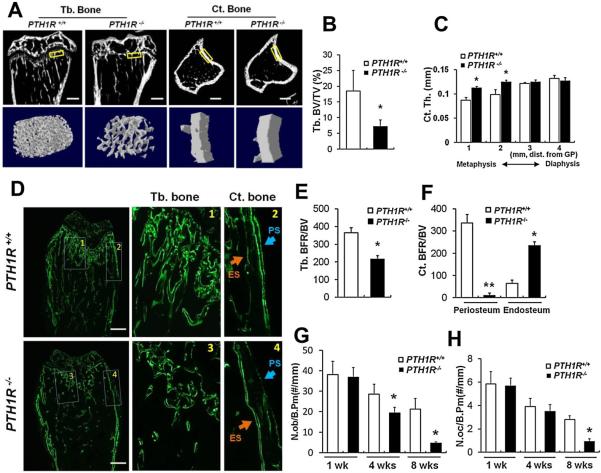
Impaired bone formation in PTH1R−/− mice. (A) Longitudinal sections and cross sections at proximal tibias from μCT scans on 4-week-old PTH1R+/+ and PTH1R−/− mice (upper) and three-dimensional reconstruction of selected areas (boxed) representing trabecular bone and cortical bone (lower). Scale bars=300 μm. (B, C) Quantitative μCT analysis on trabecular bone volume (B) and cortical bone thickness (C) at proximal tibias. (D) Calcein double labeling showing distinct bone formation at trabecular bone and cortical bone in proximal femura from 4-week-old mice. 1–4: magnified views of the boxed areas at metaphyseal trabecular bone (1 and 3) and cortical bone (2 and 4). ES=endosteal surface; PS=periosteal surface. Scale bars=500 μm. (E, F) Quantification of bone formation rates at trabecular bone (E) and cortical bone (F). (G, H) Measurement of the numbers of osteoblasts (G) and osteoclasts (H) at the proximal tibias in mice at 1, 4, and 8 weeks of age. Data shown represent means±SD for five animals per group. *p<0.05 versus PTH1R+/+; **p<0.01 versus PTH1R+/+.

