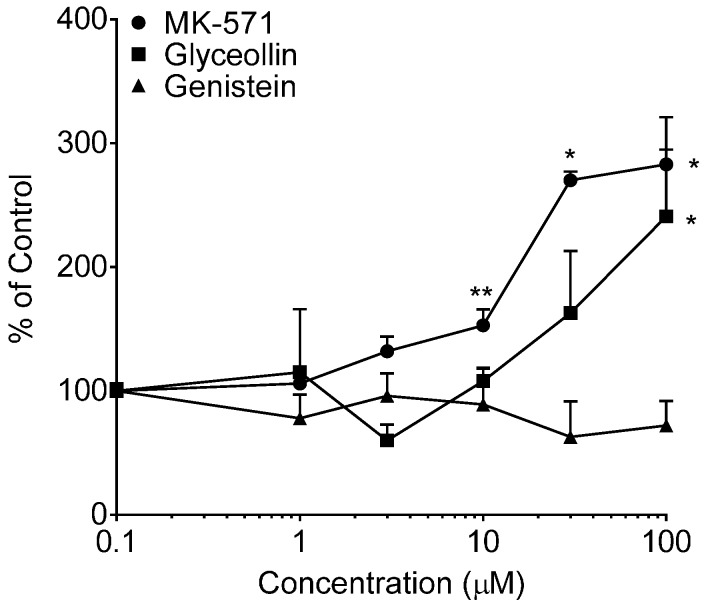
Figure 5.
Calcein uptake in Caco-2 cells. Net fluorescence normalized to cell protein was measured following a 30-min incubation with 0.5 µM CAM in the presence of varying concentrations of MK-571, glyceollin or genistein from 0 µM (control, arbitrarily represented as 0.1 µM on the log-scale) to 100 µM. Results are expressed as the mean + SEM from two separate experiments (MK-571) or three separate experiments (glyceollin and genistein), with N = 4 for each concentration per experiment. * indicates significantly different from the respective compound control (p < 0.05) from a one-way ANOVA followed by Tukey’s t-test; ** indicates significantly different from the control, 30 and 100 µM conditions.

