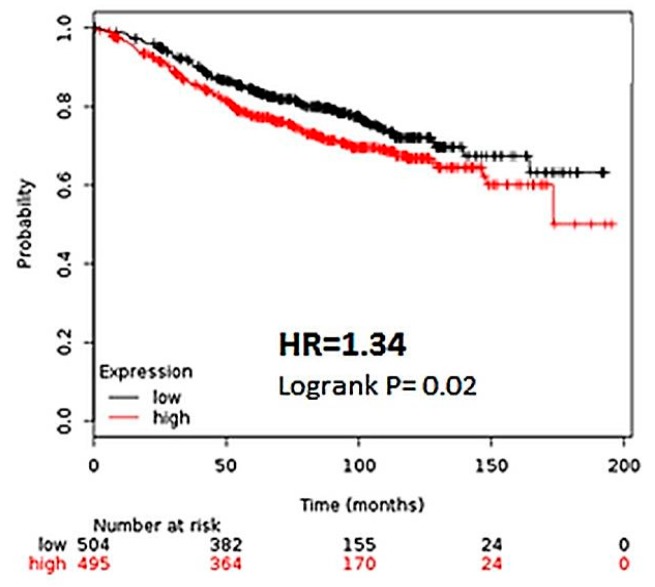
Figure 3.
The CK2α expression is predictive of relapse in patients on hormonal therapy. In Km Plotter, microarray data was selected from patients that had received hormonal therapy during treatment for breast cancer. The data was then stratified according to CK2α expression. Hazard ratio (HR) and Logrank p values are shown. Low expression of CK2α expression (below median) is noted in black, and the high CK2α expression (above median) is noted in red.

