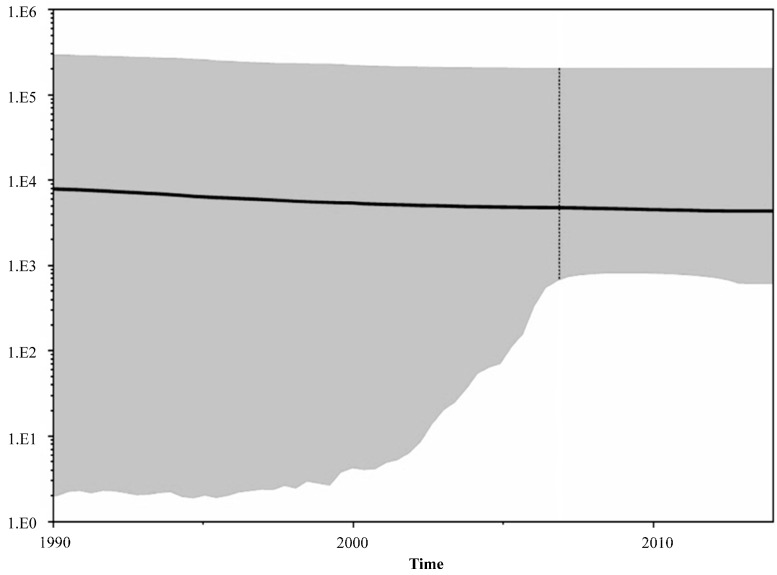
Figure 3.
Bayesian skyline plots for the HIV-1 recombinant B/D in Puerto Rico (2011–2014). (n = 40) The plots represent number of effective population size (Y = log10) through time (X = time). The line represents the median of number of lineages with upper and lower 95% highest posterior density interval (HPD) estimates. The mean mutation rate was estimated as 1.665 × 10⁻³ nucleotide substitutions per site per year. A constant rate of evolution is observed in the last decade.

