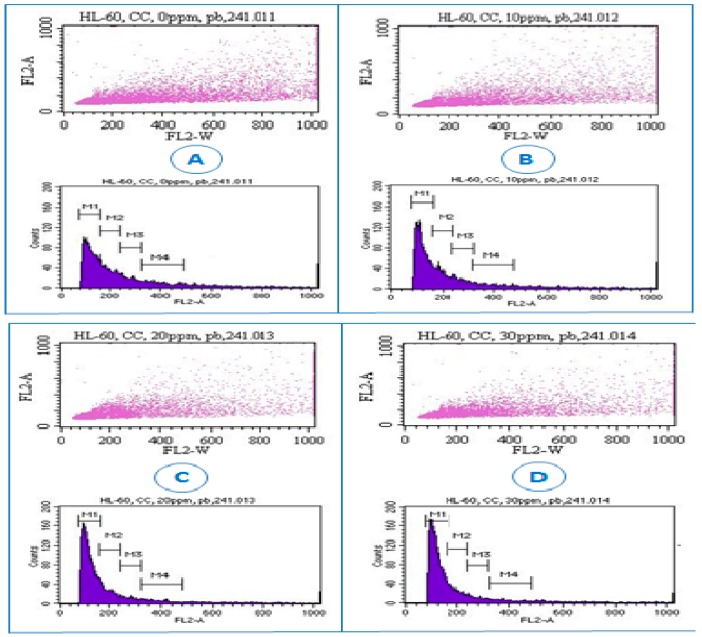
Figure 5.
Representative dot plots and histograms showing cell cycle distribution in lead nitrate-treated HL-60 cells. Cell cycle distribution was determined by the propidium iodide staining method, and stained cells were analyzed by flow cytometry (FACS Calibar; Becton-Dickinson) using CellQuest software. A total of 10,000 cells were analyzed per sample. (A) control; (B) 10 μg/mL Pb(NO3)2; (C) 20 μg/mL Pb(NO3)2; (D) and 30 μg/mL Pb(NO3)2. Three experiments were performed, and 1 representative experiment is shown.

