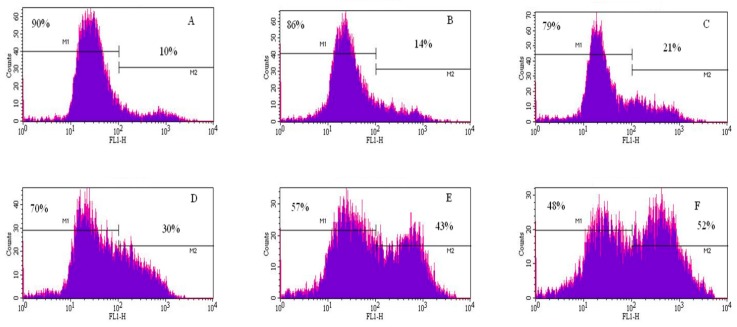
Figure 5.
Representative flow cytometry analysis data from annexin V/PI assay. The histograms show a comparison of the distribution of annexin V/PI negative cells (M1) and annexin V/PI positive cells (M2) after 48 h exposure to cadmium chloride. A = control; B = 1 μg/mL; C = 2 μg/mL; D = 3 μg/mL; E = 4 μg/mL; and F = 5 μg/mL.

