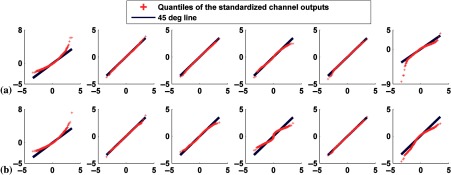
Fig. 13.
Q–Q plots comparing the distributions of standardized channel outputs with the theoretical standard normal distribution with signal extent variability and without anatomical variability. The defects’ extents were 5% and 25%. They were located at the anterolateral wall. The axes are as described in Fig. 5. The columns represent the outputs from the six channels defined in Fig. 3. The rows are for the defect-present data having severities of (a) 25% and (b) 50%.

