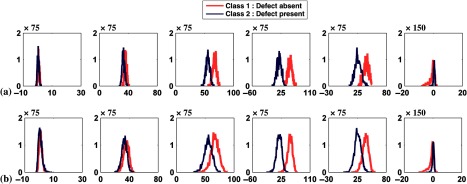
Fig. 4.
Histogram plots of the channel outputs when neither signal nor anatomical variability was included. The horizontal axis is the channel output intensity and the vertical axis is the frequency of occurrence. The columns represent the outputs from the six channels as defined in Fig. 3. The rows are (a) without uptake variability and (b) with uptake variability. Sixty-four histogram bins were used.

