
FIG 6.
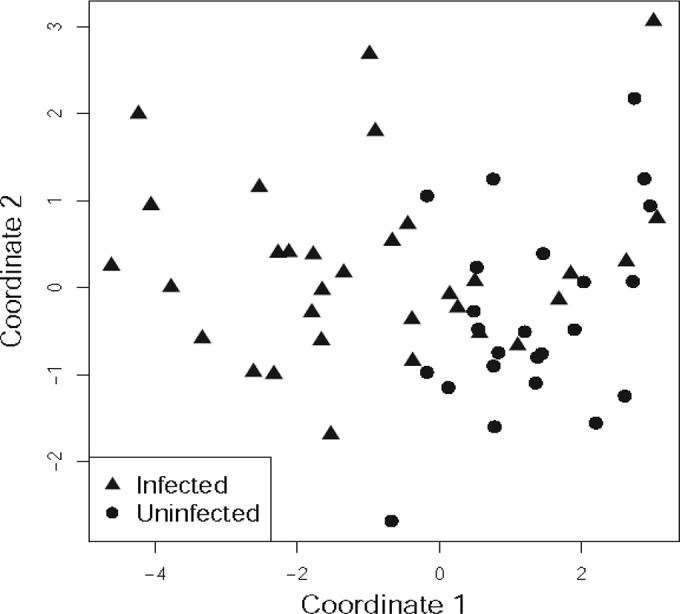
MDS analysis reveals clear trends in the systemic cytokine levels in Strongyloides infection. MDS plots for log2-transformed plasma cytokine levels were constructed to analyze the trends in the differences of systemic cytokine levels between infected and uninfected individuals. Each symbol represents one individual based on values of all of the cytokines studied. The percentage of variation is depicted on the two axes. The distance between each symbol represents the relatedness between each individual.