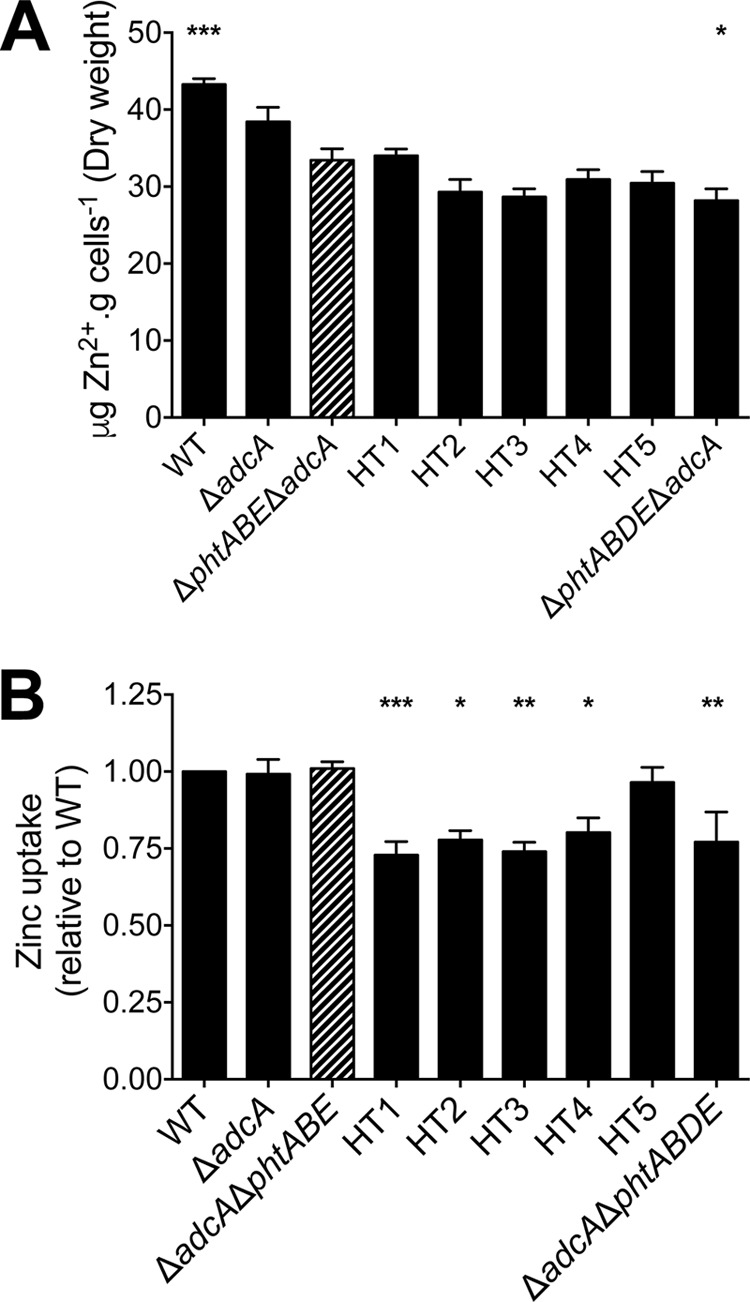
FIG 4.

(A) Whole-cell Zn2+ accumulation of control and HT mutant strains as determined by ICP-MS. (B) FluoZin-3 AM Zn2+ uptake assay examining control and HT mutant strains. Zinc uptake for each of the strains is shown relative to that for the wild type. In both assays, all strains were compared to the ΔadcA ΔphtABE mutant (striped bars) by one-way ANOVA using Dunnett's posttest, and statistical significance is indicated (*, P < 0.05; **, P < 0.01; ***, P < 0.001). Data are means (± the SEM) from a minimum of three biological replicates.
